Music Library Analysis, or: “Put Your Records On”
Summary of Deliverables
By the end of HW04, here’s what you’ll need to submit to Gradescope:
SongAnalysis.javareadme_songs.txt
0. Getting started
All files should be available for you in the “Music Library Analysis” assignment on Codio. If you need to download starter files or song library files, you can do so here.
A. Goals
When we use services like Spotify, Apple Music, or Pandora to stream music, we authorize them to collect and store data about us as individuals. This data includes the information we provide directly and the statistics we generate through our listening behavior, which are fairly straightforward and are given with some degree of informed consent. The data they keep on users also includes guesses they make about our behavior. To quote from Spotify’s Privacy Policy, the data they store on each user includes “inferences (i.e., our understanding) of your interests and preferences based on your usage of the Spotify Service.” These inferences have some straightforward uses that benefit us as users, like improving personal recommendations for new music or building procedurally generated playlists. On the other hand, these assumptions that they make about users are also used to sell advertisements on the platform—advertisements that are sometimes personalized to appeal directly to individual users.
This model of data collection is firmly entrenched nowadays, and it has considerable advantages and drawbacks for us as users of these platforms. We benefit from better curation and more efficient delivery of information, but we often have little choice but to offer our personal data up in exchange for commonly desired goods & services.
There are two primary aims of this assignment. The first is the straightforward learning goal of helping you build skills in Data Science. The second is to allow you to practice these skills on data that’s unique to you, giving you some insight into the kinds of inferences that services like Spotify might make about you.
B. Background
For this assignment, you will be writing functions that answer questions about a Spotify user’s taste based on their Liked Songs collection. You can download your own Spotify data using this tool if you want to run your code on your own music library. If you don’t have Spotify, or if you don’t want to use your own data, that’s fine too. You can do your analysis on the provided example files.
If you choose to download your own Spotify data, make sure to download all available data properties by clicking the gear icon on the web app and enabling all “include” options.
C. What You Will Do
First, you will modify one line of the readSong function provided to you so that your program properly parses the data contained in a file. (This part should be quite quick.)
Then, you will implement four functions of your choice (two from each batch of three) that allow you to generate some summary data about an array of Songs: the most popular year for releases or the variability of energy among tracks in a user’s library, for example.
Finally, you’ll build a simple data visualization to chart the relationship among energy, danceability, and loudness in a user’s Songs.
We have provided many unit tests in the file SongAnalysisTest.java that you can use to periodically evaluate your own work. The Gradescope autograder has one withheld test for each function, so it may benefit you to write your own test cases (potentially with your own CSV files) to make sure that your functions are written properly. You do not have to submit your tests, so you should feel free to modify the test file as much as you like—including by commenting out tests for functions that you don’t plan to implement.
1. Column Selection
There are quite a lot of columns in the dataset! Here’s a full list of them.
"Track URI","Track Name","Artist URI(s)","Artist Name(s)","Album URI","Album Name","Album Artist URI(s)","Album Artist Name(s)","Album Release Date","Album Image URL","Disc Number","Track Number","Track Duration (ms)","Track Preview URL","Explicit","Popularity","ISRC","Added By","Added At","Artist Genres","Danceability","Energy","Key","Loudness","Mode","Speechiness","Acousticness","Instrumentalness","Liveness","Valence","Tempo","Time Signature","Album Genres","Label","Copyrights"
At the end of this writeup, there’s a full description of the purpose of each column. We won’t use all of them. We’re interested in using Track Name, Artist Name(s), Album Name, Album Release Date, Track Duration (ms), Popularity, Artist Genres, Danceability, Energy, & Loudness. Most of the logic for reading data from the file is implemented for you. The only thing you need to change are the values stored in a particular array.
Locate the variable colsToInclude inside the function readSong(). colsToInclude is an array that specifies the indices of the columns to be included. If colsToInclude is initialized to {2, 3}, we would read only Artist URI(s) and Artist Name(s). Change the initial value of colsToInclude so that we include all of the 10 columns specified in the previous paragraphs. You’ll have to count their positions in the larger list to figure out which index corresponds to which column!
You can check your work by running the program with a CSV filename provided as a command line argument. You should see a sampling of one in every fifty songs in the file printed out like the following example:
$ java SongAnalysis sharry_songs.csv
Song[trackName=Who Would You Be For Me, artistNames=[Ljava.lang.String;@5674cd4d, albumName=Who Would You Be For Me, albumReleaseDate=2023-09-08, trackDuration=301333, popularity=53, genres=[Ljava.lang.String;@63961c42, danceability=0.547, energy=0.573, loudness=-6.732]
Song[trackName=Satellite, artistNames=[Ljava.lang.String;@1be6f5c3, albumName=Satellite, albumReleaseDate=2022-06-08, trackDuration=174540, popularity=38, genres=[Ljava.lang.String;@6b884d57, danceability=0.511, energy=0.55, loudness=-8.323]
...
Song[trackName=Purple Rain, artistNames=[Ljava.lang.String;@42110406, albumName=Purple Rain, albumReleaseDate=1984-06-25, trackDuration=520786, popularity=75, genres=[Ljava.lang.String;@531d72ca, danceability=0.367, energy=0.452, loudness=-10.422]
2. Summary Statistic Questions
Find the multi-line comment indicating the start of “SECTION A” in SongAnalysis.java. In this section, three function stubs have been written for you. You must implement two of these three functions. If you implement all three, only the first two will be graded—you cannot receive extra credit for implementing more of these.
Unit tests for each of these functions can be found in the file SongAnalysisTest.java. The Gradescope autograder uses some unit tests that have not been shared with you to grade your submission, so you should write other tests based on other provided files to help verify the correctness of your program.
countSongsFromYear
Count & return the number of songs from a specific year in the library. Specifically: find the number of Song records in the input array (Song[] library) that have a release year that matches the given input year. Keep in mind that the albumReleaseDate() accessor function returns a String either in the format YYYY-MM-DD (year-month-day) or YYYY (just the year if the release day is unknown.) Think about how you can compare the first four characters of the albumReleaseDate property to a given int year.
Edge Cases: if library is an empty array, return 0.
songNameWithMostGenres
Find the song with the most genres in the library and returns its name. Each Song record contains an array of genre names accessible by calling the genres() accessor function. Return the name of the Song record that has the longest such array.
Edge Cases: if library is an empty array, return "".
calculatePopularityRange
Calculate the range of popularity values in the library among Song records that have non-zero popularity. If a Song record has 0 popularity, then either the data is missing or the song is very obscure. Since we can’t tell which is which, we’ll ignore these entries entirely. To find the range of popularity values, find the song with the maximum popularity and the song with the minimum popularity and calculate the difference between them.
Edge Cases: if library is an empty array, or if all songs in the library have popularity 0, return 0.
3. Complex Aggregation Questions
Find the multi-line comment indicating the start of “SECTION B” in SongAnalysis.java. In this section, three function stubs have been written for you. You must implement two of these three functions. If you implement all three, only the first two will be graded—you cannot receive extra credit for implementing more of these.
Unit tests for each of these functions can be found in the file SongAnalysisTest.java. The Gradescope autograder uses some unit tests that have not been shared with you to grade your submission, so you should write other tests based on other provided files to help verify the correctness of your program.
findSongsWithArtist
Selects all songs by a specific artist in the library. Keep in mind that a song may have many artists. The song should be included in the output if any of its artists match the input. For example, for the library generated from sharry_songs.csv, I might call findSongsWithArtist(library, "Phoebe Bridgers"). The output would include each of the following three songs, since Phoebe Bridgers is listed as one of the artists in each case:
Leonard Cohen by [boygenius, Julien Baker, Phoebe Bridgers, Lucy Dacus],
Motion Sickness by [Phoebe Bridgers],
Didn't Know What I Was in For by [Better Oblivion Community Center, Phoebe Bridgers, Conor Oberst]
You will be returning a new array of Song records that contains each Song featuring the given artist. You will probably need to iterate through library twice: once to count how many Song records feature the given artist for the purposes of initializing the output array, and then once again to copy the records into the output array.
standardDeviationOfEnergy
Help identify how variable the given library’s energy levels are! Standard deviation is a statistical measure of how far on average each value in a sample is from the mean of that sample. This gives a numeric answer to the question of how tightly clustered the data is around the average value. If a library has low standard deviation, you’d expect the songs to all have a pretty similar energy level. For a high standard deviation, then the library has a bunch of songs much more (and much less) energetic than the average song.
Calculating the standard deviation ($\sigma$) is not much more complex than calculating the mean. The formula is as follows:
\[\sigma = \sqrt{\frac{1}{n} \sum^n_{i=0}(x_i - \mu)^2}\]where $n$ is the number of Song records in the library, $x_i$ represents the energy value for the Song at position $i$ in the library array, and $\mu$ represents the average Song energy.
For example, if we have three songs with energies $0.4, 0.8, 0.6$, then the average energy is $0.6$. The standard deviation is therefore
\[\sqrt{\frac{1}{3}\left( (0.4-0.6)^2 + (0.8 - 0.6)^2 + (0.6 - 0.6)^2\right)} = 0.163299...\]longestTrackByDecade
Return a Song[] containing the longest songs by decade. Decades are defined starting as 1960-1969, 1970-1979, etc., up until 2020-2029. (Of course, there are no songs after 2023…)There are seven decades all told, so the output array should contain seven Song records. If there is no Song present in a given decade, the array should contain a null value in the corresponding position.
4. Scatter Plot
Complete the scatterPlot function. Draw a scatter plot that contains one point per song. The x-axis should represent the danceability of the song. The y-axis should represent the energy of the song. Each dot should be drawn with a pen radius that increases with the loudness of the Song. A song with a loudness of -60 (very quiet) should be drawn with a pen radius of 0.001. A song with a loudness of 0 (very loud) should be drawn with a pen radius of 0.015. All loudnessess in between should scale linearly (-30 is halfway between the limits, so a Song with this loudness would be drawn with a radius of 0.008).
The metrics of danceability and energy are already values set between 0 and 1, and so these values can be used directly as coordinates. The process is slightly more complicated for calculating radius based on loudness, so we provide the formula for linear scaling below. There are several different ways of doing this that are all correct, so if you prefer to calculate the radius scaling using your own method, go right ahead!
\[\text{radius} = 0.001 + \frac{\text{loudness} - (-60)}{0 - (-60)} * \left (0.015 - 0.001 \right )\]When run on the songs in sharry_songs.csv, the most basic version of the output should look like the following:
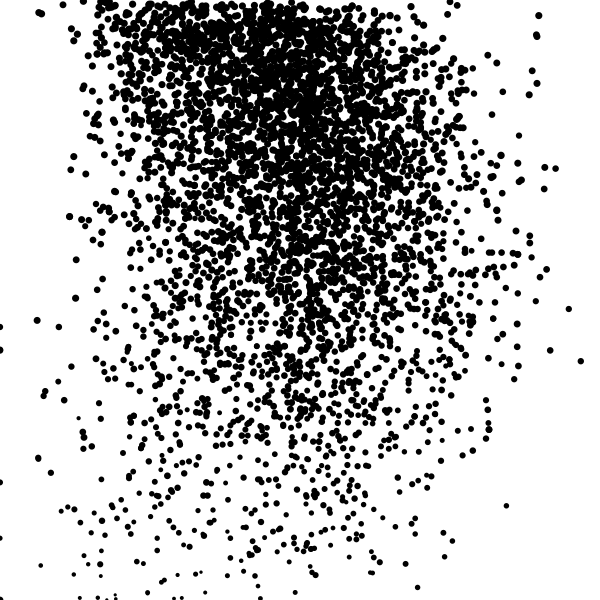
The above requirements are all that are necessary. To make the output look even better, you could consider making the following optional additions:
- color points by year/decade
- add a title
- add x- and y-axis lines & labels
- make the chart interactive
5. Readme & Submission
A. Readme
Complete readme_songs.txt in the same way that you have done for previous assignments.
B. Submission
Submit SongAnalysis.java, readme_songs.txt on Gradescope.
Your code will be tested for compilation and checkstyle errors upon submission.
Please note that the autograder does not reflect your complete grade for this assignment since your scatter plot will be manually graded.
Important: Remember to delete the print statements before submitting.
If you encounter any autograder-related issues, please make a private post on Ed.
6. Appendix (Data Overview)
Here is a brief overview of all of the columns included in the dataset.
| Column ID | Description |
|---|---|
| Track URI | Link to the song on Spotify |
| Track Name | The full title of the song |
| Artist URI(s) | Links to each artist performing on the song |
| Artist Name(s) | Names of each artist performing on the song |
| Album URI | Link to the album on which the song appears |
| Album Name | Title of the album on which the song appears |
| Album Artist URI(s) | Links to each artist or artists responsible for the entire album |
| Album Artist Name(s) | Names of the artist or artists responsible for the entire album |
| Album Release Date | The date when the album was released |
| Album Image URL | A URL linking to an image or cover art of the album |
| Disc Number | The disc number if the album is part of a multi-disc release |
| Track Number | The position of the track within the album’s tracklist |
| Track Duration (ms) | The duration of the track in milliseconds |
| Track Preview URL | A URL to a preview or sample of the track |
| Explicit | Indicates whether the track contains explicit content (e.g., explicit lyrics) |
| Popularity | A measure of the track’s popularity on the platform |
| ISRC | International Standard Recording Code, a unique identifier for recordings |
| Added By | Name or identifier of the user who added the track |
| Added At | Timestamp indicating when the track was added |
| Artist Genres | Genres associated with the artist(s) of the track |
| Danceability | A measure of how suitable the track is for dancing on a scale from 0-1 |
| Energy | A measure of the intensity and activity of the track (0-1) |
| Key | The key in which the track is composed (0 = C, 1 = C#, etc.) |
| Loudness | A measure of the track’s overall loudness (lower is quieter) |
| Mode | Indicates whether the track is in a major (1) or minor key (0) |
| Speechiness | A measure of the presence of spoken words in the track (0-1) |
| Acousticness | A measure of the track’s acoustic qualities (0-1) |
| Instrumentalness | A measure of the track’s instrumental qualities (0-1) |
| Liveness | A measure of the presence of a live audience in the recording (0-1) |
| Valence | A measure of the track’s positivity or happiness (0-1) |
| Tempo | The tempo or beats per minute (BPM) of the track |
| Time Signature | The time signature of the track’s musical structure |
| Album Genres | Genres associated with the album |
| Label | The record label associated with the track or album |
| Copyrights | Information regarding the copyrights associated with the track or album |