Cheat checkers typically compare all pairs of code submission using techniques similar to those of the previous assignment, and give a sorted list of the top matches. One simple, but surprisingly effective way of comparing two code submissions is to compare them line by line, counting up how many characters differ between the two lines, and how many characters are added or removed from the ends of the line. The number of differences is used to computing a matching cost that represents how different the two files are. The lower the matching cost, the more similar the files.
You already know enough to be able to implement this — we often assign this in CIS 110 before the current assignment, although not this semester. We also often include the results of this cheat checker in our reports to the OSC even though we also use much more sophisticated cheat checkers.
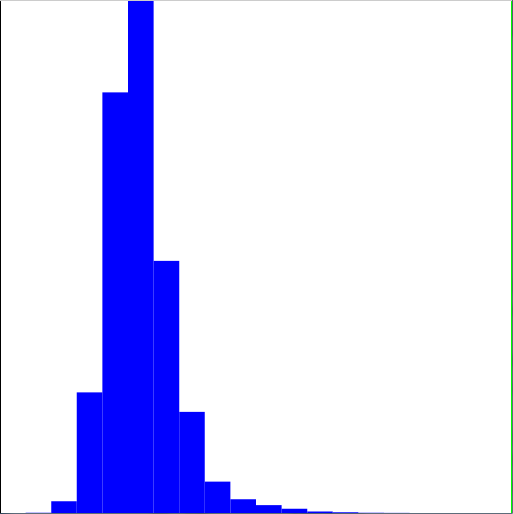
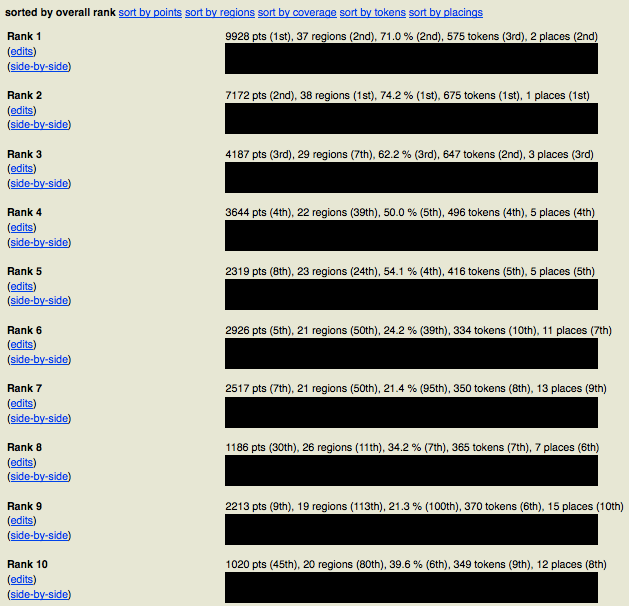
We're also interested in the distribution, also called a histogram, of matching costs. That is the focus of this assignment. Any pair of independently written programs should have fairly similar matching costs (actually, you expect the cost distribution to form a bell curve); assignment pairs with abnormally low matching costs relative to the bell curve are likely to be copied. The images below show the kind of histogram your program will generate, as well as a report generated by an on-line cheat checker. All identifying information has been removed.
|
|
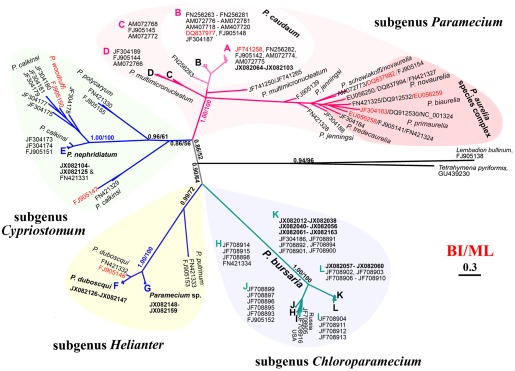
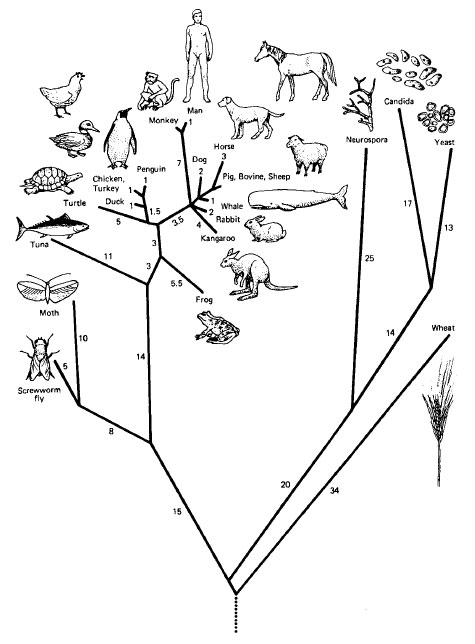
Comparing a protein from two different species can give us some information about how closely related they are, but it is even more interesting to compare the protein among numerous species. That helps us answer questions like, "Which two species are most closely related?" or "Which two species are most distant?" We can also build a phylogenetic tree that hierarchically groups species based on how similar the protein is, and thereby gain insight into the entire evolutionary tree. Computational biologists build similar trees of different genes to help learn about their functions — very similar genes often control similar functions. (This type of tree is called a minimum spanning tree, and is at the heart of many compression formats including JPEG, as well as being an essential part of route planning and many other algorithms. You will learn all about minimum spanning trees in CIS 121.) Two examples of phylogenetic trees based on the cytochrome c protein are shown below.
|
 |
Complex data often requires illustration. In this assignment, you will be implementing a histogram to visualize complex data. This data examines the similarity between two pairs of information.
This assignment builds on understanding the range of similarity between pairs, and find the most similar pairs. Finding the most similar items out of a pool of many is of course important to a very wide range of applications, starting with searching for similar documents or images. We will focus on two applications: protein matching and cheat checking.
We provide you a reference implementation of the pairwise comparison programs. You can assume this implementation has no defects, and will work as specified in this assignment.
You will write a program RankSimilarity.java that matches all pairs of documents, computes a histogram of the result, and plots it. Each of these steps is explained in detail in its own section of the assignment, in the order we recommend you implement them. The histogram is built using a cost matrix. A cost matrix is a matrix that identifies the similarity between two items being classified. In Cheat Checking, this can be two student homeworks. In biology, this can be used to determine how similar protein chairs are. The lower the cost is, the more similar the documents are. We use a histogram to identify documents whose cost difference is abnormally small, indication cheating. You do not need to worry about the details of how this difference is calculated for this assignment.
To get you started, we provide a complete reference implementation as a compiled .class file that you can play with. We also give you a skeleton version of the program that calls the reference implementation for the interesting bits and a RankHelpers class with the tedious code to read in data. This lets you start by implementing the drawHistogram() method, then replace the other pieces with your own code one by one. Your program must conform to the API given below.
API
public class RankSimilarity
--------------------------------------------------------------------------------------------------------
* Draw the histogram */
public static void drawHistogram(double[] histogram)

* Compute the matching costs for all pairs of documents
* returns an array giving the number of matches in each histogram bin
* costs is an array of matches in the same format as costArray
* numBins is the number of bins for the histogram (must be at least 1)
*/
public static int[] buildHistogram(int[][] costs, int numBins, boolean inverse)

* Sorts the costs array in increasing order of cost using selection sort
* costs is an array of matches in the same format as costArray
*/
public static void selectionSortCosts(int[][] costs)

* Computes the matching costs for all pairs of documents
* returns a 2-D array with one row for each match
* docs is an array of documents, each represented as an array of lines
*/
public static int[][] computeCosts(String[][] docs)

* read in the protein file, cost matrix, or list of documents,
* compute all match costs, sort them, and create a histogram
*/
public static void main(String[] args)
Files to Download - for your convenience, all files can be found in this zip file here
- Download the RankSimilarityReference.class reference implementation and save it to your folder for this homework assignment. You may need to right-click the link to save the file rather than running it. This is a compiled Java program, not source code that you can examine. However, you will be able to run it and compare your output to its output for testing purposes. You can also call its functions directly for more fine-grained testing. Later steps of the assignment include suggestions for how to do this.
- Download the RankHelpers.java file, and save it or move it to your folder for this homework assignment. This file includes the code to read in data
- Download the skeleton RankSimilarity.java file, and save it or move it to your folder for this homework assignment.
- Download CompareDocumentsReference.class and save it to your folder for this homework assignment. Like RankSimilarityReference.class, you will need to use it for testing purposes.
- Download CompareStringsReference.class and save it to your folder for this assignment. This is yet another compiled .class file to be used in testing.
- Download cytochrome_c.txt file and save it to your folder for this assignment. This file contains data set of cytochrome c proteins for many different species.
- Download costs-cheatchecker.txt file and save it to your folder for this assignment. This is an anonymized data set containing cheat checking data.
Before you start
- Make sure the program compiles. Each of the skeleton functions includes a return statement so that it will compile. You will need to replace these with your own code eventually.
- Add an appropriate file header.
- Continue to the following tabs for detailed explanations of drawHistogram(), buildHistogram(), selectionSortCosts() and computeCosts().
We provide you with a reference implementation of the program that you can run to explore how your program is supposed to work. You can also use the functions it provides as drop-in replacements for many of the parts that you will write so that you end each of the subsequent assignment parts with a complete, working program. This makes your program much easier to test.
At this time, do not worry about the contents of the data files, just know that the ReferenceRankSimilarity.class file works to the specification of this assignment.
There are a few ways to run the reference implementation. We provide the same main() function in the skeleton code for your own program, which you will be able to run in exactly the same ways.
- java RankSimilarityReference costfile.txt: If you run the program with exactly one argument, and that argument begins with "cost," (e.g. "java RankSimilarityReference costs-cheatchecker.txt") the program assumes it is the name of a file that contains a pre-computed cost matrix. It will load this data as the costArray, sort it, build a histogram, and plot it. This allows us to provide you datasets for which it would take many hours to compute the cost matrix, and/or whose underlying data is confidential and cannot be distributed.
- java RankSimilarityReference filename.txt: If you run the program with exactly one argument, and that argument does not begin with "cost," the program assumes it is a text file containing protein data. This is useful for the cytochrome_c.txt dataset. Each protein will be treated as a one-line document, and the species's English name will be used as the document's name.
- java RankSimilarityReference file1.txt file2.txt file3.txt ...: If you run the program with more than one argument, it assumes each argument is a text file that should be compared. Each file is loaded as a separate document, and the filenames are used as the documents' names. You can use this to assemble datasets of your own, but be warned that you need about 30 documents (or more) for the histograms you will plot to become interesting.
- You must have a vertical and horizontal axis. You do not need to label these axes, nor do they need to have a numeric scale, but the axes must be visible.
- You must compute the width and height of each bin so that they fit no matter how many bins there are. Both the number of bins and maximum value may change while your program is running.
- You must draw a vertical line (or something equally helpful) at the mouse's location that stretches from the top to the bottom of the plot. The line should not cover the bars of the histogram.
Drawing the Histogram: A histogram is just a type of bar chart. It groups the possible values of each piece of data into a series of ranges (called bins), and counts how many data values lie in each range (i.e. fall into each bin). For example, if the possible matching costs fall between 0 and 100, a 10-bin histogram counts the number of matches with costs of 0 to 9 (bin 0), 10 to 19 (bin 1), 20 to 29 (bin 2), etc. A bar chart of the numbers of A, B, C, D, and F grades given in a course is another example of a histogram.
You will store the histogram of matching scores as an array of doubles. Each entry of the array stores the number of matches whose costs fall into that bin. The length of the array tells you the number of bins.
- Plot each histogram bin b as a rectangle using PennDraw.filledRectangle() or PennDraw.filledPolygon().
- Use the number of bins and the fact that the x-axis scales from 0 to 1 in order to determine the width of each bin. Determine the height of the bin by dividing the bin value by the maximum bin value. Use the bin index and the previously calculated bin width in order to determine the x-coordinate of the lower left-hand vertex. Using the lower lefthand vertex, the bin width, and bin height, you can now calculate all x and y coordinates for the bin's rectangle.
- Pick any color you find attractive for the rectangles.
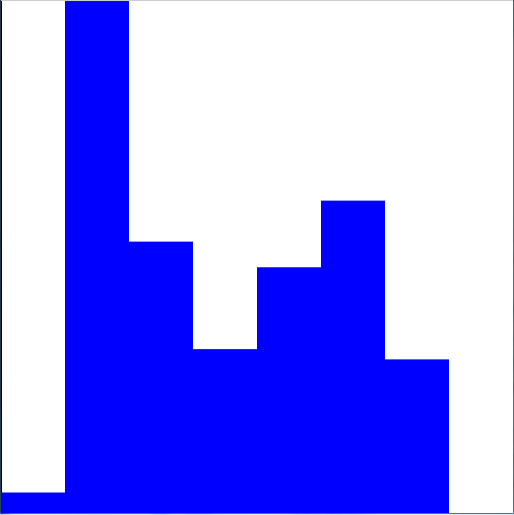
Checkpoint: to ensure your histogram works, you should get this as a result of calling "java RankSimilarity costs-cheatchecker.txt" in the interactions pane.
|
|
| A Sample Histogram. |
As another test, try creating your own histograms as double
arrays. For example, if in main you write:
double[] thisHist = {0.4, 10.0, 5.3, 3.2, 4.8, 6.1, 3.0, 0.0};
drawHistogram(thisHist);
You should get the histogram pictured below:
|
Writing your event loop: Just like in previous assignments using PennDraw, you need to add a loop to your main() function that checks for keyboard input and draws the histogram. This is your event loop, and it will be responsible for calling drawHistogram().
Inside your main method you should construct a while loop to monitor for key press events listed below. This loops will be similar to StampSketch in HW1. You must implement the following three behaviors:
-
If the 'p' key is pressed, find the mouse's x location (there is an PennDraw method for doing this) and multiply by 100, and cast to an integer. (The mouse location should be a value between 0 and 1.) Print out that many best matches in descending order of cost. For instance, if the x location is 0.1, you should print the 10 most similar matches, starting with the 10th-most similar and ending with the top match. For each match, you must print all the data about the match (index of the first document, index of the second document, and matching score), but the format does not need to be identical to the reference output.
How to access the individual matches: The matches are stored in the two-dimensional array variable costArray that is sorted in increasing order of cost. This means the most similar pair is at costArray[0], the next most similar pair at costArray[1], etc. Each row of this array corresponds to a single match and has three columns. The first two columns record the indices of the first and second documents in the match; the last column records the match's cost. We have defined symbolic constants in the skeleton for each of these columns that you should use. For instance, the cost of match i is costArray[i][COST].
Checkpoint: if you run java RankSimilarity costs-cheatchecker.txt and press p to generate AT LEAST 5 matches, the LAST 5 matches should be (in order):
623 530 2402
294 94 2125
707 94 2079
707 294 2009
759 623 1804
If you are getting different values, you have made an error.One common error is printing in reverse order. If your cost scores are ASCENDING, rather than DESCENDING, you are likely iterating through the list in the wrong direction with your for loop.
Another possible error is that you are printing in descending order, but you get different values that what is above. In this case, you are likely starting at the wrong index point in the array. -
If the 'i' key is pressed, toggle between the normal histogram and a modified inverse of the bin values. You should handle this by calling buildHistogram() with the inverse argument set to true or false. Toggle between them each time you press 'i'.
The formula for computed inverse bin values is described in the "Building the Histogram" section on the "Preparing the Data" tab. For now you do not need to worry about it. For now, we suggest testing this with the costs-cheatchecker.txt data file. The standard histogram shows a bell-curve-like distribution of similarity between submission. There are hundreds of thousands of submission pairs in this data set, and a few are plagiarized. Those assignments are represented by very small bars at the left edge of the graph—so small you can't see them. Inverting the histogram will make these "pop out," and make the bulge of "normal similarity" disappear.
- If the 'r' key is pressed, rebuild
the histogram. Compute a number of bins for the
histogram using the formula
Call# of bins = 100 * mouse's x location / 5
to rebuild the histogram with the computed number of bins. Use Math.ceil to force the number of bins to round up. If the user clicks in a place such that the number of bins is zero, instead show a histogram with 1 bin (as you cannot have a histogram with zero bins). Note: If r is pressed while the mouse is out of bounds (that is, off the window pane) to the left or right, ensure your histogram does not generate more than 20 bins or less than 1 bin.histogram = buildHistogram(costArray, # of bins, inverse);
Checkpoint: when you alternate r and i, the number of bins and the state of whether or not the histogram is showing the inverse should be maintained. For example, if you press r to set the number of bins to 10, and then press i to show the inverse, the histogram shown should still have 10 bins. Additionally, if you change the number of bins while showing the inverse, the new histogram should still be in an inverse state.
Detecting mouse and key presses: Consult the documentation for PennDraw.
"Building the histogram"
Now that drawing works, you can implement your own buildHistogram() function. The function should use the costs array to create and return a histogram with numBins bins. It is the last step before drawing, which means you can easily test and debug it using a cost matrix that has been computed and sorted by the reference implementation.
- The costs variable is a 2-D array with the same format
as the costArray variable you used in main(). If
costs[i][FIRST] is first, and costs[i][SECOND] is
second, then the cost from comparing the pair of
documents (first, second) is stored in
costs[i][COST].
costs[0][FIRST]: index of first document in match 0 costs[0][SECOND]: index of second document in match 0 costs[0][COST]: cost of comparing (first, second) costs[1][FIRST]: index of first document in match 1 costs[1][SECOND]: index of second document in match 1 costs[1][COST]: cost of comparing (first, second) costs[2][FIRST]: index of first document in match 2 costs[2][SECOND]: index of second document in match 2 costs[2][COST]: cost of comparing (first, second) ... ... ...
- You may assume that costs is sorted in increasing order of match cost. That means that maxCost is simply the cost of the last match in the array.
- The histogram is just an array of doubles with numBins elements.
- If maxCost is the highest cost of any match, then each bin in the histogram should cover a range of maxCost divided by numBins. For example, if the high match cost is 10, and the histogram should have four bins, each bin covers a range of 10 / 4 = 2.5. To compute the bin that a specific cost should fall into, divide the cost by the range, and take the integer part of the result. Be careful to make sure the highest cost gets put into bin numBins - 1 and not the non-existent bin numBins.
Inverting the histogram: When the inverse argument is true, you should compute a modified inverse of each bin value. Replace each bin value n with it's reciprocal 1 / n as long as n is not zero. If n is zero, do not change it.
The effect of inverting the histogram is that very tall bars in the histogram disappear (1 / very large number is close to 0), while very short bars suddenly get tall (the lowest non-zero count a bin could have is 1, and 1 / 1 = 1). For cheat-checking, we aren't interested in the masses of assignment pairs that are equally similar—the ones that correspond to tall histogram bars. Instead, we are interesting in the very few assignment pairs that are much more similar than all other pairs. In terms of the histogram, we expect most bins correspond to low cost/high similarity to have a zero count, but a few my have a non-zero (but small) count corresponding to plagiarized assignments. On the standard histogram, the counts in those bins are still so low that we can't see the bars; but inverting them makes the bars large. So the plagiarized assignments tend to pop out, and the non-plagiarized ones tend to disappear.
Computing costs
computeCosts() takes a 2-D array of documents—docs[i](look below for a visual representation of this array)is the ith document, represented as an array of lines—and computes all pairwise matches. It returns the resulting 2-D array.
- docs is a 2-D array of strings where each row
represents a document, and each column represents a line
of text in the documents:
docs[0][0]: line 0 of document 0 docs[0][1]: line 1 of document 0 docs[0][2]: line 2 of document 0 ... docs[1][0]: line 0 of document 1 docs[1][1]: line 1 of document 1 docs[1][2]: line 2 of document 1 ... docs[2][0]: line 0 of document 2 docs[2][1]: line 1 of document 2 docs[2][2]: line 2 of document 2 ... ... ... ... ... - For every pair of documents first and second where the index of the second < the index of the first, set costs[row][FIRST] to first, costs[row][SECOND] to second, and costs[row][COST] to CompareDocumentsReference.compareDocuments(docs[first], docs[second], false). (This condition the index of the second < the index of the first ensures you compare every document to every other document exactly once. Remember that matching document A to document B is the same as matching document B to document A. We're just saying that when we compare two documents, we'll list the lower-numbered document first. There is also no point matching document A to itself, so first and second should never be equal.)
- If there are N documents, then there are N(N-1)/2 total pairs to match.
- You will need to keep track of the next row to fill in in the costs array as well as the first and second documents.
- computeCosts() is called from within RankHelpers.java. Early versions of RankHelpers.java called the reference implementation; double-check your copy to make sure it calls RankSimilarity.computeCosts() and not RankSimilarityReference.computeCosts(). If it is calling the reference implementation, re-download it. Otherwise you won't be testing your own computeCosts() function at all.
Sorting the data: For the following sections of the assignment, you may find it neccessary to have the data sorted by the COST value. While we have not covered sorting in class yet, you will need to have selectionSortCosts(int[][] costs) implemented. Simply use the following code body to implement this function:
public static void selectionSortCosts(int[][] array) {
    for(int i = 0; i < array.length - 1; i++) {
        int min = array[i][COST];
        int minIndex = i;
        for(int j = i + 1; j < array.length; j++) {
            if (array[j][COST] < min) {
                min = array[j][COST];
                minIndex = j;
            }
        }
        int[] temp = array[i];
        array[i] = array[minIndex];
        array[minIndex] = temp;
    }
}
Sorting will be covered in the class at a later date. However, this is an example of an selection sort. Take some time to try to understand how the code works. To sort the costArray, simply call:
selectionSortCosts(costArray)
Note that we don't directly set costArray equal to the output of this method. This is because arrays are pass-by-reference. This means that when this method alters the input array, it alters the array's location in memory, not just the value of the array inside the function.
We provide a few possible extra credit ideas for this assignment, which are described below.
There are many opportunities for extra credit on this assignment, although you will be able to earn at most 3 extra credit points (and remember that the impact of extra credit on your grade is limited). Some of these ideas are relatively easy, and others are harder. Finish the assignment first, submit it, then work on these ideas as they interest you.
You should implement your extra credit in a program RankSimilarityEC.java that you submit as a separate file from your main submission. This simplifies grading and gives you more latitude to change any part of the program you want. You can also submit a zip file, extra.zip containing any additional java files, data, images, etc. that are needed to run you extra credit.
- Display some status information in the application window such as the number of matches that will be printed if you press 'p' and the number of bins that will be used for a new histogram if you press 'r'.
- Improve the appearance of the axes, e.g. by adding arrows at the ends, tic marks, a scale, and names.
- Make the bars of the histogram more attractive. This could include highlighting the bar under the mouse (and possibly displaying information about it), a more elaborate color scheme, more interesting shapes than rectangles (provided they don't make the data harder to visualize), incorporating images, animating their appearance, or anything else you think improves the data visualization or is cool.
- Fit a Gaussian (bell curve) or other model to the histogram data, and superimpose it on the histogram. There are a few possible ways to draw a curve, including drawing line segments, drawing points and drawing a polygon. Any of these are fine. For the most accurate curve, you'll need one vertex for every pixel in the x- direction, but you could specify fewer vertices if that takes too long to draw.
- Experiment with better ways to highlight suspicious pairs of assignments than just inverting the histogram values. For instance, if you implement the previous idea, you could also mark any histogram bin that is much larger than a Gaussian model would predict. (We have not tested this, so we can't say how well they will work; you might well come up with an idea that works better!)
Group Extra Credit
Important: each group member must have completed the assignment BEFORE working on the group assignment. This is to ensure that you are not sharing code on the base homework.
If you want to get ambitious with the extra credit, You may work in groups of up to four students provided:
- you have all completed and submitted the main assignment before you start on them;
- you share only the code specifically related to these ideas with each other (not your entire extra credit program);
- you each list everyone you work with on each idea in your readme, along with the contribution each person made.
Of course, you must not share your code with anyone outside the group either. Remember that we run extra credit code through cheat checkers as well as the main assignment. If you haven't properly documented who you worked with, we won't be able to ascertain that the identical code you are submitting falls within the permitted collaboration!
Fill out the readme_rank.txt file in DrJava and submit the homework using the submission system. If you did extra credit requiring extra classes or other material, remember to submit your RankSimilarityEC.java file as well as any extra material if needed (compress this into an extra.zip file as with previous homework extra credit).